Gráficos en la gestión de viajes
- Licencia de Genesys Cloud CX 1, Genesys Cloud CX 2, Genesys Cloud CX 2 Digital, Genesys Cloud CX 3, Genesys Cloud CX 3 Digital o Genesys Cloud CX 4
- Complemento de gestión de viajes
- Función Journey Management Creator, Editor o Viewer
Los gráficos utilizan los datos de Journey Management para ofrecer análisis de tendencias en , ayudar en la resolución de problemas y proporcionar información sobre el comportamiento operativo y de los clientes. Puede crear gráficos para investigar, evaluar y revisar las métricas del viaje. Con la ayuda de los gráficos, puede analizar las tendencias a lo largo del tiempo, comparar puntos de datos, seguir el progreso o los cambios y comprender a sus clientes.
Puede crear gráficos con los datos de a partir de su recorrido previamente construido.
Los gráficos ayudan a los gestores de centros de contacto, gestores de trayectos, gestores de la experiencia del cliente y analistas a:
- comprender el recorrido del cliente durante un periodo
- comprender las relaciones o correlaciones entre distintas fichas de sucesos
- comprender el impacto en el recorrido integral del cliente en el centro de contacto
- optimizar el rendimiento del viaje, cuando se produjo un cambio en el rendimiento
Filtros en los gráficos
Los gráficos sólo recuperan los datos del valor del trayecto. Si decide excluir determinados valores de atributos, el gráfico no los incluirá. Alternativamente, si elige incluir sólo ciertos valores de atributos, entonces sólo los valores incluidos estarán presentes en el desglose del gráfico.
Genesys Cloud aplica los mismos filtros para los gráficos que aplicó para el viaje.
- Puede crear hasta 10 gráficos por trayecto.
- Si duplica un trayecto, Genesys Cloud también duplica las configuraciones de gráfico del trayecto.
Crear un gráfico para un viaje
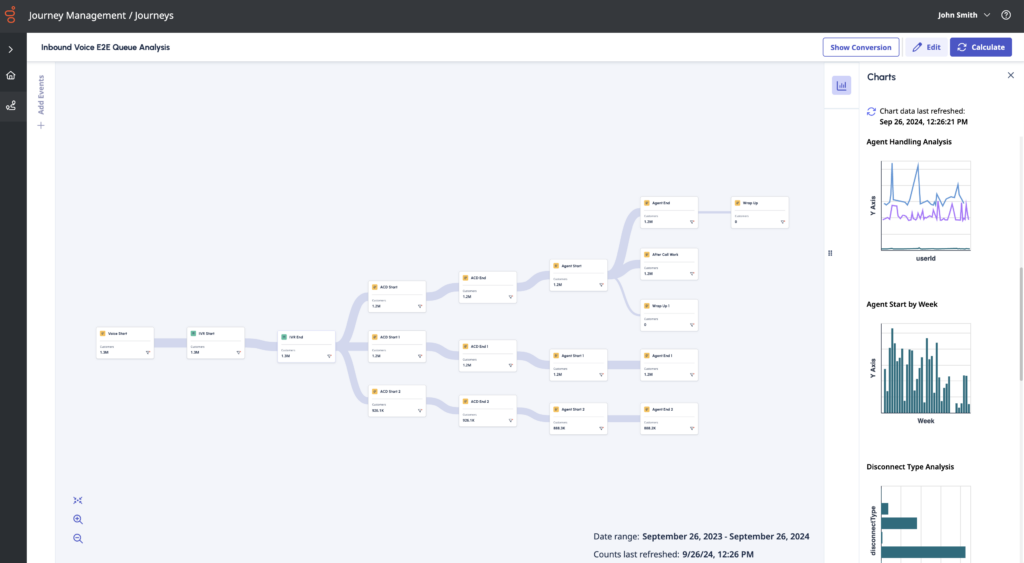
En la parte derecha del lienzo del viaje, puede ver los gráficos creados. Los gráficos calculados muestran una miniatura visual; los gráficos que aún necesitan cálculo muestran el mensaje Requiere cálculo .
Para acceder a la configuración de los gráficos, haga clic en el icono Charts situado en la esquina superior derecha de la pantalla. Haga clic en un gráfico para ver una representación visual detallada.
Crear un nuevo gráfico
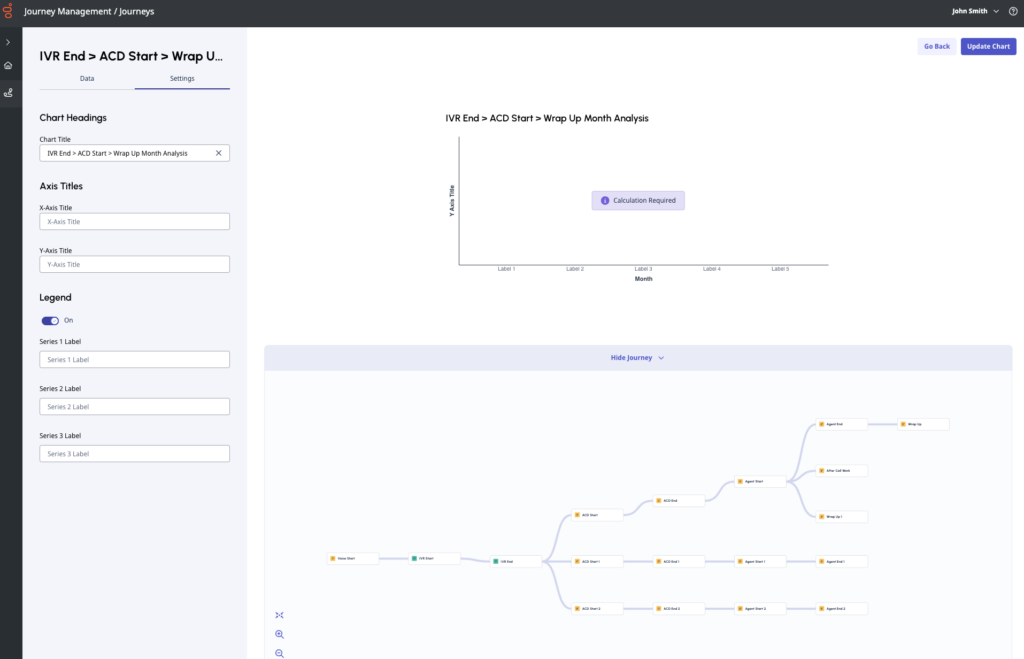
Haga clic en Nuevo gráfico. Genesys Cloud le llevará a la pantalla de configuración del gráfico. Su viaje debe estar en el modo de edición para que pueda editar también las cartas.
En la parte izquierda de la pantalla de configuración de la carta, puede editar su carta; la parte derecha muestra la representación visual de la carta y su recorrido como referencia. Si no desea ver el trayecto, haga clic en Ocultar trayecto.
- Los gráficos se activan cuando hay al menos un evento en el viaje. Puedes añadir gráficos a medida que añades y conectas eventos, o puedes crear primero el recorrido de interés y luego decidir cómo utilizar los gráficos para apoyar ese análisis.
- Las funciones Editar, Guardar y Calcular rigen tanto el lienzo de recorrido como el editor de gráficos. No se puede realizar un cálculo en un gráfico sin realizar un cálculo en todo el recorrido. Por lo tanto, Genesys Cloud recomienda crear el recorrido, guardarlo y, a continuación, crear un par de gráficos correspondientes antes de realizar un cálculo.
Ficha Configuración
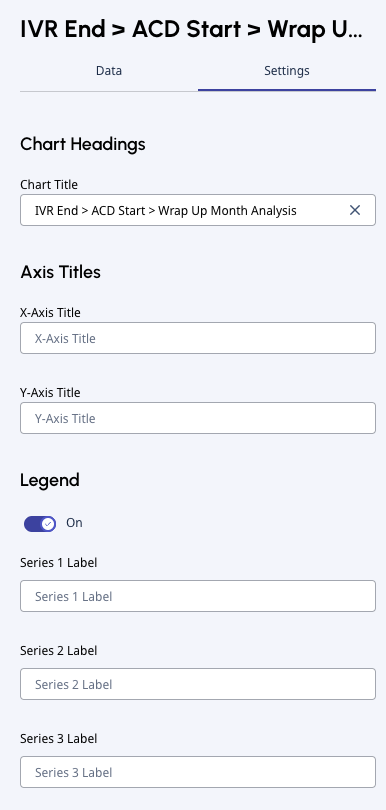
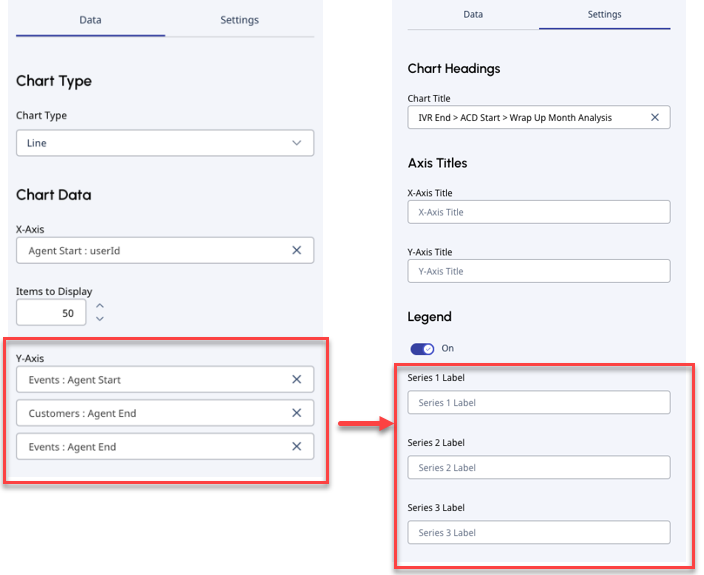
Establezca los encabezamientos de los gráficos y los nombres de las etiquetas en Configuración.
- Introduzca un nombre para el gráfico en Título del gráfico.
- Introduzca los títulos de los ejes en Título del eje X y Título del eje Y.
- Activar o desactivar la leyenda .
- Si define puntos de datos del eje Y en la pestaña Data, puede actualizar sus etiquetas en Settings. Establezca los nombres de las etiquetas de la serie . Dispone del mismo número de etiquetas Series que de puntos de datos del eje Y que defina en la pestaña Datos.
Ficha Datos
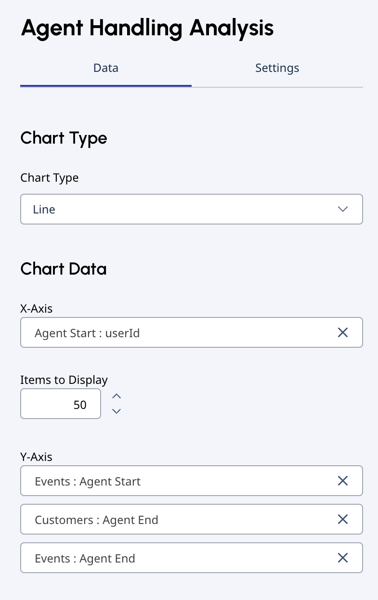
Puede establecer el tipo de gráfico y definir los datos del gráfico.
Tipo de gráfico
Puede elegir entre tres tipos de gráficos: Columna, Barra, Línea.
- Genesys Cloud recomienda utilizar gráficos de barras para datos categóricos, como etiquetas.
- Si tiene más de dos variables y más de 30 valores, Genesys Cloud le recomienda que utilice un gráfico de líneas.
Datos del gráfico
Los gráficos de gestión de viajes permiten contabilizar los datos de los eventos por tiempo y valores de atributos. Puede mostrar clientes o eventos. Los clientes son los clientes únicos que se ajustan a los criterios del gráfico. Los eventos son el número total de interacciones que se ajustan a los criterios del gráfico.
- Las series temporales incluyen: día, semana, mes o año.
- Los valores de los atributos incluyen: valores por defecto y valores definidos por la organización.
Ejemplos de valores por defecto: dirección, tipos de mensajes, motivos de desconexión, tipo de transferencia.
Ejemplos de valores definidos por la organización: QueueID, flowID, userID (agentes), intents, botID, wrapupCode.
- Establezca los puntos de datos del eje X en la pestaña Data.
- Valores por defecto para Tiempo:
Valor del tiempo Valor por defecto Día Datos de los últimos 28 días Semana Últimas 12 semanas de datos Mes Últimos 13 meses de datos Año Año natural y año natural anterior de los datos
Nota: Puede seleccionar hasta 50 elementos para mostrar, por lo que puede aumentar cualquiera de los valores de tiempo hasta 50. - Valores por defecto para Atributo: Genesys Cloud enumera las 50 principales etiquetas.
Nota:-
Si crea un gráfico en evento:atributo selección en el eje X de un evento, sólo puede configurar el gráfico en ese evento específico, o en los eventos que vienen después de ese evento específico en la ruta de viaje. No es posible crear un gráfico sobre acontecimientos que hayan precedido a ese acontecimiento concreto, o que no se encuentren en su trayectoria.
-
No todos los valores de los atributos tienen datos. Para más información, consulte Filtros en los gráficos.
-
- Valores por defecto para Tiempo:
- Establezca los puntos de datos del eje Y: puede elegir Clientes o Eventos como tipo de datos. Seleccione el tipo de datos en el desplegable y, a continuación, seleccione el evento correspondiente.
- Si define puntos de datos en el eje Y, puede volver a Configuración y actualizar sus etiquetas. Seleccione los nombres de las etiquetas de la serie . Dispone del mismo número de etiquetas Series que puntos de datos del eje Y haya definido.
- Si define puntos de datos en el eje Y, puede volver a Configuración y actualizar sus etiquetas. Seleccione los nombres de las etiquetas de la serie . Dispone del mismo número de etiquetas Series que puntos de datos del eje Y haya definido.
- Haga clic en Crear gráfico. Genesys Cloud le devuelve al lienzo del viaje.
Puede optar por crear otro gráfico o ejecutar un cálculo.
Calcular gráficos
- Abra el trayecto para el que desea realizar los cálculos.
- Haga clic en Calcular en la esquina superior derecha.
- Genesys Cloud ejecuta un nuevo cálculo sobre el trayecto y todos los gráficos asociados.
Nota: El cálculo puede tardar algún tiempo en completarse.
Comprender los resultados de los gráficos
Para abrir un gráfico, haga clic en el icono Charts situado en la esquina superior derecha del lienzo del recorrido.
Haga clic en un gráfico para ver una visualización detallada.
Contabilizar cálculos de gráficos
- Si su viaje se encuentra en el modo Analizador , haga clic en Ver detalles del gráfico para ver la configuración del gráfico. No puedes editar tu gráfico en este estado.
- Si su viaje se encuentra en el modo de edición , haga clic en Editar carta para abrir el editor de cartas.
Ejemplos de
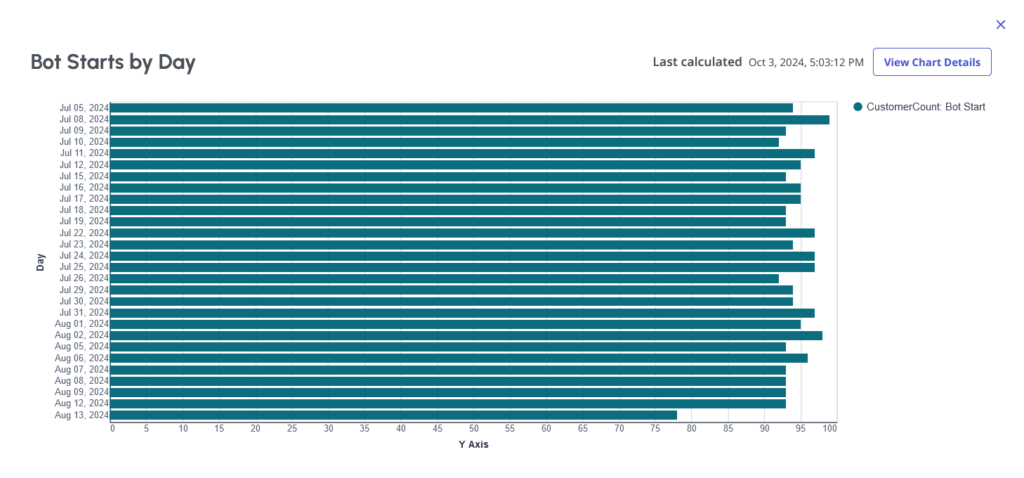
Este gráfico de ejemplo muestra un gráfico de barras.
- El Título se establece en Bot Inicia por día.
- El eje Y se establece en Día valor de tiempo, y el eje X se establece en Clientes: Bot Iniciar evento en la pestaña Data.
- Como no se ha establecido ninguna etiqueta para el punto de datos del eje Y en la pestaña Settings, no aparece ningún título de etiqueta.
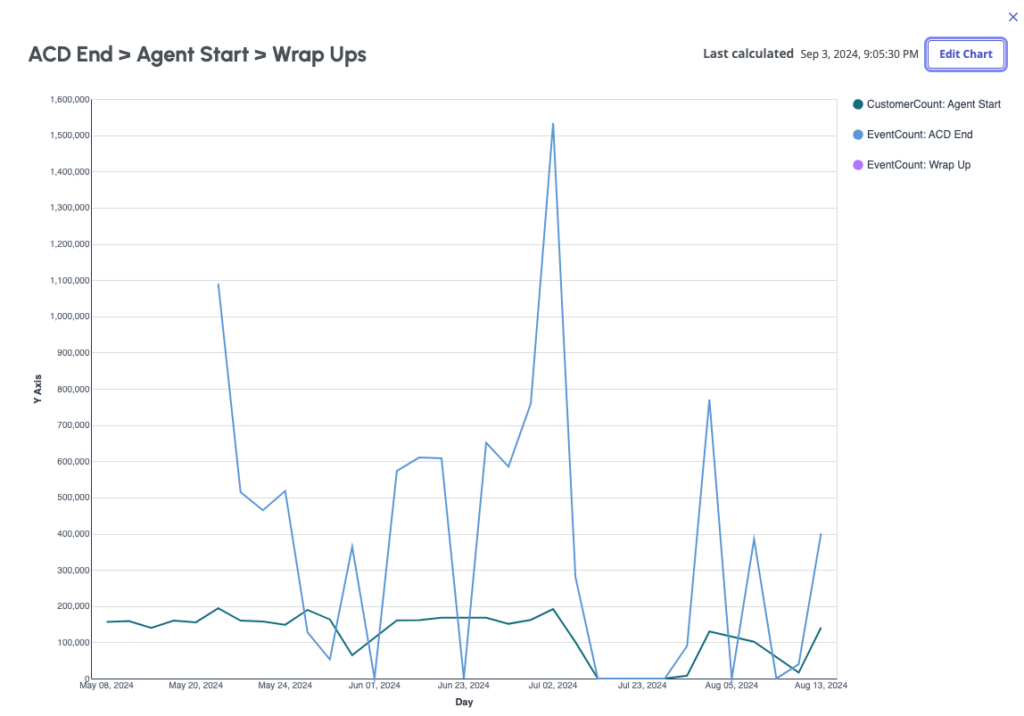
Este gráfico de ejemplo muestra un gráfico lineal.
- El Título se establece en ACD End > Agent Start > Wrap Ups.
- El eje X está configurado en Día valor de tiempo. El eje Y tiene tres puntos de datos: CuentaClientes: Agent Start, EventCount: ACD Fin, EventCount: Envuelva.
- Para los puntos de datos del eje Y, las etiquetas numéricas se establecen en la pestaña Settings.
Errores en los resultados de los gráficos
Los gráficos pueden mostrar los siguientes errores:
- Gráfico no válido: Se ha eliminado un evento del viaje.
- Requiere cálculo: Aún no ha realizado ningún cálculo sobre el viaje. Calcula el recorrido para que el gráfico pueda actualizarse.
- Cálculo de actualización: El cálculo anterior no es válido, porque se ha editado el trayecto. Para actualizar el gráfico, ejecute un cálculo.
- Sin datos: No existen datos para crear el gráfico especificado. Las posibles razones son que el atributo seleccionado no tiene datos debido a un filtro, o la naturaleza del propio evento.

